|
| | ||||||
| Main | News | Fixed bugs | Download | Contacts | Help | Blog | |
| Order | Update | Gallery | About Us | Links | Forum | Citation | |
|
Chemcraft gallery
If you are a "usual" chemist not dealing with computational chemistry, you can look at this pages first:
Chemcraft for non-quantum chemists Chemcraft for crystallographers Chemcraft for molecular dynamics researchers
1. Dragging/rotating molecular fragments for building a Zn-porphyrin:
The following video illustrates the process shown on the picture above:
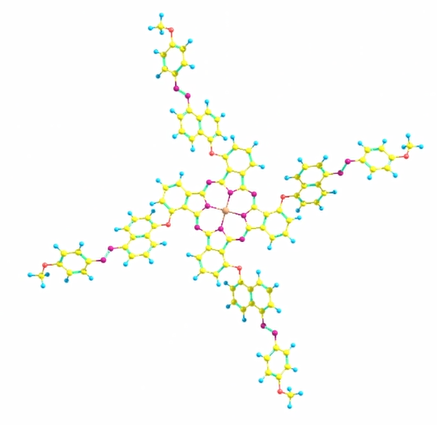
2. Building a complicated porphyrin derivative in Chemcraft:
Video:
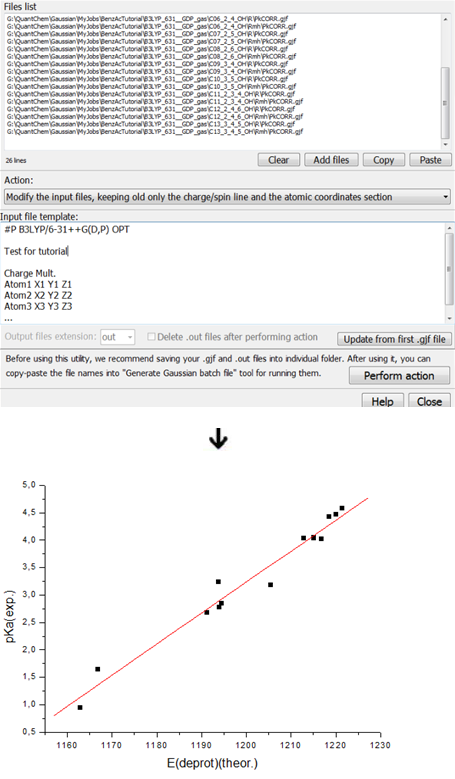
3. Scripting "magic" in Chemcraft which helps you to build correlations between computed and experimental properties instead of directly comparing a computed property with the experiment:
See this webpage for more information:
Some tutorials on quantum chemistry and scripting "magic" in Chemcraft.
4. Obtaining a Z-matrix of Cs2TeO3 molecule using Chemcraft:
Video:
5. The molecule can be constructed from fragments via "Unite two groups" or "Add fragment" menu items:
6. Dummy atoms can be inserted into the center of coordinates of selected atoms:
7. The use of Clipboard to copy molecular fragments from different files into one common structure:
8. "Monodentate" (linearly-bonded) ligands are easy to work with, but "bidentate" ones require some more work. Example of building such a molecule:
Video:
9. Chemcraft provides a "Structures combiner" utility, which allows one to quickly obtain molecular structures if he has already computed the structures of close homologues:
Video:
See also this page for more help.
10. For some big molecules with complicated structure, Chemcraft tools of adding custom planes and vectors can be quite useful. Here you can see an animation of building this molecule in C4 symmetry: Video:
You can see at this video, that the tool "Edit/Operations with vectors and planes" can be a useful addition to "Edit/Set point group" utility, because the latter requires sufficiently close geometry of symmetry-equivalent parts of molecule, and for big molecules, sometimes it is difficult to build them so, if each of them is constructed individually;
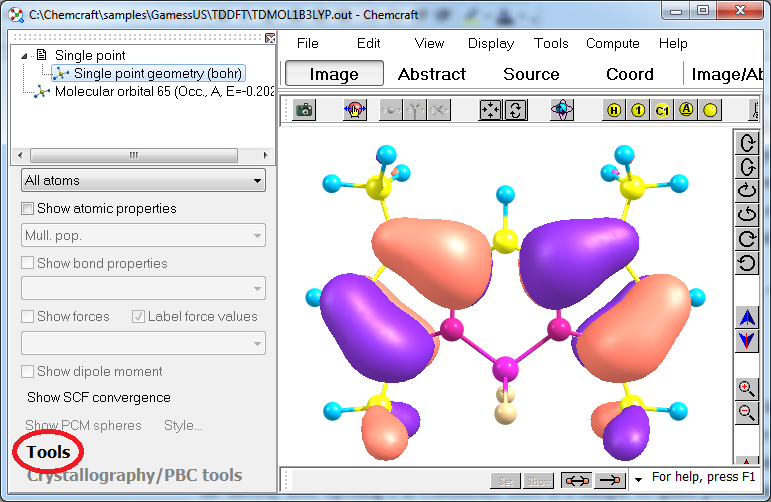
11. Chemcraft shows the data extracted from output files produced by QC packages in a form of a structured hierarchical list:
The following data from the output files can be visualized: molecular orbitals, vibrational modes, TDDFT spectra, atomic properties like Mulliken charges, bond properties like bond orders, dipole moments, SCF convergence graphs, optimization convergence graphs, PES scan graphs (including 2-dimensional ones), IRC scan graphs, energy gradients, MO energies diagrams, NMR spin-spin coupling constants, and other properties. To render molecular orbitals from a file, click "Single point geometry" at the left, then "Tools" below, then "Orbitals/Render orbitals". DO NOT USE THE "COMPUTE/MOLECULAR ORBITALS" MENU ITEM IF YOU HAVE ORBITALS PRESENTED IN YOUR OUTPUT FILE (this menu item computes the molecular orbitals via semi-empirical approach implemented in XTB program):
12. Although often the QC computations are performed on Linux clusters, in many cases it is quite convenient to perform the computations on PCs. We tried to make Chemcraft as convenient as possible for such tasks, and included the features like running an input file directly after opening it in Chemcraft. Here is a sample of quick performing a small "research job" on Windows PC with Chemcraft, using the semiempirial AM1 method:
13. In Coord mode, the atomic coordinates can be exported in different formats, either in Angstroms or Bohrs. They can be saved in different formats (xmol, .sdf, .mfj, .tnk, .mdl, etc) via the File menu as well.
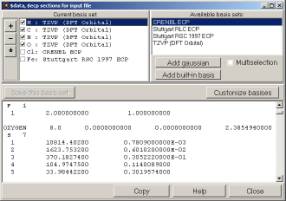
14. Chemcraft can quickly create sections of Gaussian and Gamess output files with non-standard basis sets, which can be extracted from the basis set descriptions obtained at basissetexchange.org website:
15. The concept of Chemcraft is maximal easiness of exporting via Clipboard of any data read from output files into programs like Excel or Origin:
16. One more example of working with Clipboard in Chemcraft is biulding animations from a set of pictures copied through Clipboard: for example, the simple animation below (visualization of disordered .cif file) was created with only 17 clicks (menu item "Tools/Create animation/Build animated gif file.."):
17. The archive of molecular fragments can be supplemented with custom fragm
18. When working with cube files, they can be combined, different operations with them can be performed (sum, multiplication, etc), isosurface of one cube can be colored by another cube:
19. Multiple atoms can be selected in different ways, in particular with these buttons:
20. Two or more structures can be "merged" via "Tools/Structures comparer/merge..." menu item (this option can be used, for example, to compare crystallographic and ab initio structures):
21. Often, when an output file with geometry optimization is browsed, the molecular orientation switches several times within optimization steps. To avoid this problem, use the "Tools/Trajectory analysis tools/Make modifications of all geometries in the trajectory/Set common orientations for all geometries" menu item (at the left window, after clicking on the "Optimization" node):
.
22. Menu item "View/Release all captions" allows the user to get the picture with several captions on each atom:
23. Chemcraft provides a Structures Comparer tool, which compares the structures from two opened files; this tool can help avoid mistakes when the input files are muddled up (for example, if you have interrupted geometry optimization, you should insert the last geometry from the output file into new input file, and then the possibility to check whether these structures are equal can be useful):
24. If you have performed a geometry optimization, and want to know whether the optimized structure is a minimum or a saddle point (and the frequency computation is too expensive), you can use the possibility to lower the molecular symmetry:
25. When working with NMR computations, it is often useful to obtain a table of chemical shifts, averaged within specified groups of atoms. These values usually correlate well with the experimental chemical shifts, and in our work we found this option much more useful than drawing an NMR spectrum. This option is shown via "Tools/Show atomic properties table option" (the "Tools" button is shown at the left bottom corner of Chemcraft window):
26. For geometry optimization jobs, Chemcraft can draw the graph "Step N vs Proximity to symmetry point group". This feature can be useful if you want to check, whether your structure is symmetrical (if you don't have the analytical frequencies):
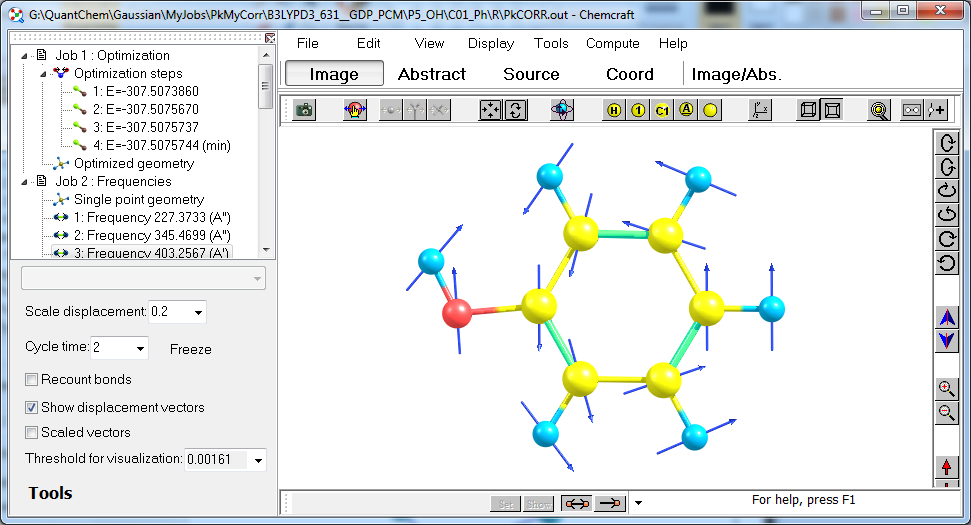
27. When a vibrational spectrum is shown, Chemcraft can color individual bands in the spectrum according to the colors of atoms mostly involved in the mode displacements:
In this display scheme the hydrogen atoms have blue colors, so the frequencies in which the hydrogens are involved mostly are colored blue in the spectrum.
28. Chemcraft can quickly find the vibrational modes in which the selected atoms are involved mostly (("Tools/Find frequencies..." at the left panel).
29. A tool for quick calculation of energies of reactions is provided:
30. If you have two molecules with close structure and different sequences of atoms, Chemcraft can automatically reorder the atoms in one of these structures to make them equal ("Tools/Structures comparer/Update atomic sequence for best match with the structure from another Chemcraft window" menu item):
31. The images can be exported in metafile (.wmf) format, in which each label and line is stored as an individual object, via Clipboard, and inserted into Word for following edit of labels and lines:
32. 3d graphs of relaxed PES scan jobs with 2 scanned parameters can be drawn:
Note that Chemcraft can build a 3d graph by a custom set of data (imported with Clipboard) via "Tools/Simple utilities/Create custom 3d graph".
33. Chemcraft can calculate the angle and distance between two planes or vectors described by groups of selected atoms:
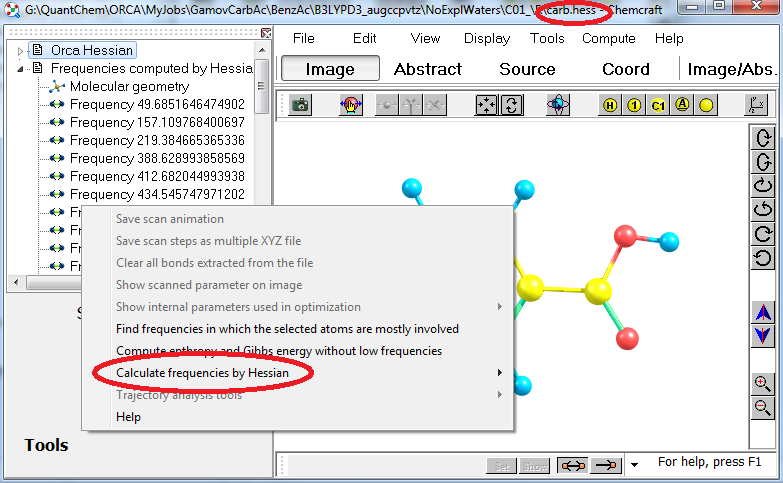
34. Chemcraft can calculate the vibrational frequencies by Hessian ("rigid rotor - harmonic oscillator" approach). This can be useful for quick prediction of the frequencies of isotopic substituted molecules. Using this feature is most convenient with Orca, since Orca computations produce .hess files with the Hessian:
35. Chemcraft can export cubes of molecular obitals in text format in the form of columns, for making operations with them in Excel/Origin. For example, with TDDFT data, most often the starting and final orbitals of a predicted excitation are not pure but rather are expressed as a linear combinations of the output of the TDDFT calculation; and Chemcraft allows one to export each orbital as a column into Excel, compute the linear combination of the orbitals and then import it back into Chemcraft for visualization:
36. The Windows version of Chemcraft can save animated pictures of molecules in the form of multiple bitmap files or animated gif files. The following standard types of animations are provided: animation of molecule rotation, vibrational frequencies, and animation of PES scans. The animations below were created using Chemcraft:
See also: Chemcraft hints
| |||||||